|
|
|||
|
NOTE : This editorial is also available as a PDF file
Summarized from Shaffer, Withnell, Dhar, Lilly, Harmon and Goodman (2003), Ear and Hearing, 24, 367-379
Lauren A. Shaffer1 and Sumitrajit Dhar2
1Department of Speech Pathology and Audiology, Ball State University, Muncie, IN 47306 2Department of Speech and Hearing Sciences, Indiana University, Bloomington, IN 47405 correspondence:Ā lashaffer@bsu.edu
The clinical utility of otoacoustic emissions (OAEs) is limited because hearing thresholds cannot be accurately or reliably predicted from OAE tests results.Ā We recently published a paper that discusses this limitation in light of current theories of how OAEs are generated.Ā The following summarizes some of the main points from the paper.Ā For further detail, additional figures, and analysis methods, the reader is referred to Shaffer et al. (2003 ) (please see footnote1). Theory of the generation mechanisms and sources of OAEs
Over the last decade, a coherent theory has developed suggesting that the different OAE types share common mechanisms of generation (Talmadge, Tubis, Long & Piskorki, 1998; Zweig & Shera, 1995).Ā Shera and Guinan (1999) suggested a re-classification of OAEs based on two mechanisms of generation, nonlinear distortion and linear coherent reflection.Ā Nonlinear distortion and linear coherent reflection can also be thought of in the terms suggested by Kemp (1986), “wave-fixed” and “place fixed”.Ā Nonlinear distortion is believed to arise from physiological nonlinearities associated with the action of the cochlear amplifier as it injects energy into the basilar membrane motion.Ā Therefore, OAE energy arising from nonlinear distortion is “fixed” to the traveling wave.Ā Reflection, on the other hand, may occur anywhere along the cochlear partition that an irregularity causes energy to be turned around.Ā There is still much uncertainty about what types of irregularities actually cause reflection in the cochlea.Ā In fact, Kemp (2002) suggested a further branching of generation terminology to distinguish between potentially passive mechanisms, such as an irregularity in hair cell number, and active mechanisms, such as variation in cochlear amplifier gain.Ā While the question of what causes reflection remains unanswered, what is known is that the irregularities are randomly distributed (Zwieg & Shera, 1995) such that energy can be reflected at sites all along the cochlear partition.Ā Most of the reflected wavelets will occur with random phase relations causing the energy to be cancelled, however, energy that is reflected under the peak of the traveling wave will have a coherent phase that allows the positive summation of energy, creating a substantial reflection component of the OAE that is recorded in the ear canal.Ā One problem with the classification system suggested by Shera and Guinan (1999) is that most emissions are not generated purely from one mechanism, but are a mix of the two different generation mechanisms, particularly as stimulus level is increased.Ā For example, stimulus frequency emissions, which are believed to arise from linear coherent reflection at low stimulus levels, may involve both nonlinear distortion and linear coherent reflection at higher stimulus levels (Long, Talmadge, & Thorp, 2001; Shera & Guinan, 1999).Ā Distortion product emissions and high-level transient evoked emissions also arise from a mix of nonlinear distortion and linear coherent reflection (Shera & Guinan, 1999; Yates & Withnell, 1999).Ā
The term ‘source’ can cause some confusion in a discussion of OAE generation.ĀĀ The term is sometimes used synonymously with generation mechanism.Ā In Shaffer et al. (2003) we use the term ‘source’ to refer to the location or site where OAE energy arises regardless of the mechanism that generates the emission.Ā The 2f1-f2 DPOAE arises predominantly from two sources (e.g. Brown, Harris & Beveridge,1996; Gaskill & Brown, 1996; Kemp & Brown, 1983; Kummer, Janssen & Arnold,1995; Talmadge et al., 1996, 1997).Ā Energy of the 2f1-f2 DPOAE first arises at the site on the basilar membrane where the stimulus induced traveling waves interact.Ā For simplicity, we refer to this region as the “overlap” region.Ā The overlap region under many stimulus conditions can be approximated as the characteristic frequency location of f2.Ā Energy arising in this location is generated predominantly by nonlinear distortion. Thus, we refer to this energy as the nonlinear component. ĀThe energy of the nonlinear component, which has a frequency of 2f1-f2, travels bi-directionally, basally toward the ear canal, and apically toward the characteristic frequency location of 2f1-f2 (CFdp).Ā At the CFdp location the energy undergoes linear coherent reflection.Ā This reflection component of the 2f1-f2 DPOAE then travels basally toward the ear canal.Ā At the stapes, some distortion product energy will pass on to the middle ear, while some energy will be reflected at this boundary causing a standing wave pattern to be developed in the cochlea and having dramatic effects on the level of the emission recorded in the ear canal (Talmadge et al., 1998; Dhar, Talmadge, Long & Tubis, 2002).Ā
Systematic variation in the amplitude of the composite DPOAE
The 2f1-f2 DPOAE measured in the ear canal
is a vector sum of the nonlinear and reflection components that originate
from two different cochlear sources and can be thought of as a composite
of these different components.Ā The energy from these different sources
interacts as it travels in the cochlea arising first at the overlap
region, then being reflected at the Cfdp region and again
at the middle ear boundary.Ā The resulting interference pattern leads
to variation in the sound pressure level and phase of the composite
DPOAE that is measured in the ear canal.Ā This variation in the sound
pressure level of the DPOAE is quasi-periodic with frequency and is
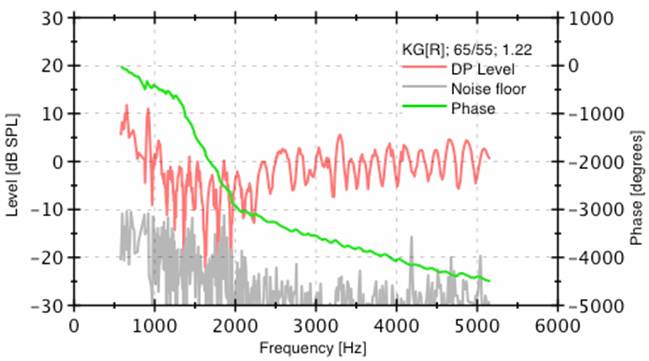
known as “fine structure” (see Figure 1 and footnote [2].Ā
ĀĀĀĀĀĀĀĀĀĀĀĀĀĀĀĀĀĀĀĀĀĀĀ
Figure 1. ĀAmplitude and phase fine structure for the 2f1-f2 DPOAE of a subject (KG) with normal hearing.Ā Note that peak to valley amplitude variation can be greater than 20 dB, and that valleys in the amplitude fine structure sometimes drop into the noise floor.Ā ĀTalmadge, Long, Tubis and Dhar (1999) used a phasor model to show that characteristic phase patterns (ramp and sawtooth patterns) result from the interaction of the nonlinear and reflection components of the 2f1-f2 DPOAE.Ā Which pattern arises depends on the relative strength of the two components, which can vary with frequency.Ā In these data, ramp patterns appear in the frequency range from approximately1500 to 2000 Hz and sawtooth patterns appear above 2000 Hz.
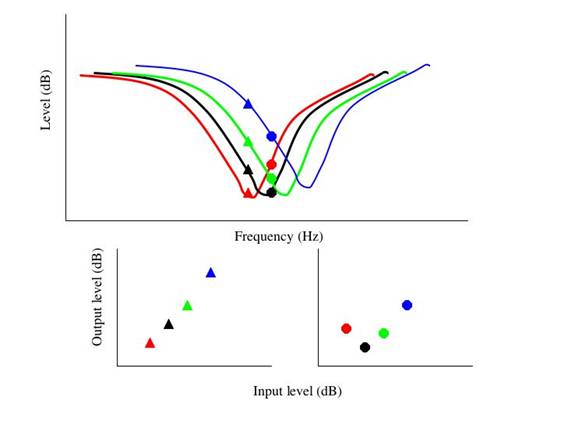
Fine structure is not observed in clinical measurements of DPOAEs because common protocols call for recording the DPOAEs at 1/3 octave intervals.Ā This resolution is too coarse to observe fine structure.Ā The typical spacing between amplitude peaks in the fine structure varies with frequency, but in the mid audiometric frequencies ranges from approximately 100-200 Hz. Peak-to-valley variation in amplitude can be 20 dB or greater in normal hearing subjects (He & Schmeidt, 1993).Ā So, while fine structure is not observed in clinical testing, its presence can greatly complicate the interpretation of the clinical DP-gram and clinical DP input/output (I/O) function (Heitmann, Waldmann & Plinkert, 1996). The problem in interpreting individual test results is that valleys or “dips” in the amplitude fine structure may drop below the confidence intervals of normative data and can also drop below the noise floor (see Figure 1).ĀĀ Such points will be interpreted as evidence of dysfunction in the frequency region where the dip occurs, when, in fact, higher resolution recordings would show that such dips are part of a normal pattern of fine structure. Problems equally arise in attempting to interpret DP I/O functions.Ā The peaks and valleys of amplitude fine structure shift with stimulus level, causing changes in the shape and slope of the I/O function.Ā This problem is illustrated schematically in Figure 2.Ā Shifts in fine structure with stimulus level may partly explain why in recent studies attempting to extrapolate thresholds from DPOAE I/O data, 30% and 60% of the I/O functions did not meet the criteria for inclusion (Boege & Janssen, 2002; Gorga, Neely, Dorn & Hoover, 2003).Ā Among normal hearing subjects, the majority did not meet the slope criterion (Gorga et al., 2003).Ā While fine structure was not considered in these studies, it may well explain the variability in I/O function slope among normal hearing subjects.
Figure 2.Ā Schematic of shift in fine structure with increasing stimulus level.Ā The colors represent different L2 levels for a constant L1.Ā Resulting I/O functions will vary in slope depending on where in the fine structure the sample is taken.Ā Frequencies near a “dip” or on the slope of fine structure can produce very different I/O functions.Ā Frequency shifts in DPOAE fine structure were first described by He and Schmeidt (1993).Ā The change in the shape or slope of I/O functions resulting from fine structure shifts with level illustrates that I/O functions are affected by the interaction of multiple source components.
At present the only way to deal with the clinical problems associated with low-resolution recording is to record with high stimulus resolution around any frequency in question to ascertain whether fine structure is influencing the DP-gram or I/O function.
Predicting behavioral thresholds from the composite DPOAE
So, how can theory of generation mechanisms and cochlear sources shed light on the limitations of the composite OAE in predicting behavioral hearing thresholds?Ā First, studies that have attempted to relate OAE amplitude to hearing thresholds typically correlate a single emission frequency to a single audiometric frequency (in the case of distortion products, the DPOAE amplitude at a given f2 frequency is correlated to the behavioral threshold at the same audiometric frequency).ĀĀ From generation theory and experimental data, we now know that for DPOAEs and high level TEOAEs there are multiple cochlear sources that contribute to the emission (Avan, Bonfils, Loth & Wit, 1993; Withnell, Yates & Kirk, 2000), therefore the amplitude of the composite OAE at a single frequency represents the sensitivity of all the cochlear sources that have contributed to the emission, not just the sensitivity at a single frequency.Ā This “mismatch” between the cochlear locations that give rise to the emission and the emission test frequency may be responsible for some of the variability observed in simple correlations. Amplitude fine structure also plays a roll in limiting the prediction of hearing thresholds from DPOAE level.Ā When data from large numbers of subjects are averaged to obtain normative values, the amplitude variation is essentially low-pass filtered and the fine structure pattern is no longer obvious in the averaged data.Ā What is obvious in the averaged data, however, is the large amplitude variance (and correspondingly large confidence interval range) resulting from fine structure (Gorga, Neely, Ohlrich, Hoover, Redner, & Peters, 1997).Ā For this reason, fine structure amplitude variation contributes to the overlap in amplitude distributions between normal hearing and impaired ears (Gorga et al., 1997), and probably also contributes to the tremendous variability seen in correlations of DPOAE level and hearing thresholds.
“Single source” or “component” DP-grams and DP I/O functions
Two different methods have been used to separate the nonlinear and reflection components of the composite DPOAE.ĀĀ Waldmann, Heitmann, & Plinkert (1997) first conceptualized the “single-source” DPOAE (sgDPOAE), later showing that a suppressor tone close in frequency to 2f1-f2 could be used to reduce the amplitude variation in fine structure (Heitmann, Waldmann, Schnitzler, Plinkert & Zenner, 1998) by suppressing the reflection component from the Cfdp region. The other technique used to separate the nonlinear and reflection components involves digital signal processing methods that exploit the observation that the phases of the two components exhibit different behaviors as a function of frequency. In fact, the two components have quite distinct phase behaviors.Ā Because the nonlinear component is associated with the stimulus traveling waves (wave-fixed), its phase is relatively invariant with frequency.Ā This behavior arises because the traveling wave exhibits an approximately constant number of cycles of vibration to the peak regardless of the frequency of the stimulus.Ā The result is that the nonlinear distortion produced always shares the same phase relation to the stimulus phase producing a flat phase versus frequency function.Ā The reflection component, on the other hand, which arises from fixed locations (place-fixed) on the cochlear partition has a rapidly rotating phase that accumulates across frequency.Ā The resulting phase versus frequency function has a steep slope.Ā From this discussion, it may be much clearer how two components, one with approximately constant phase and one with rapidly changing phase, sum together to produce the quasi-periodic pattern of amplitude and phase fine structure. Stover, Neely, and Gorga (1996) first showed that inverse fast Fourier transform (IFFT) of the DP-gram could be used to separate the components in the time domain.Ā Because of their phase properties, the nonlinear and reflection components resolve as independent peaks when an IFFT is applied to high resolution DP-gram data.Ā Time-windowing can then be used to isolate the component peaks, and FFT used to convert the time-windowed data back into “component” DP-grams.Ā Figure 3 illustrates the nonlinear and reflection component DP-grams that result from using this analysis. Kalluri and Shera (2001) showed that a suppression paradigm and the IFFT/time-windowing analysis produce equivalent results in isolating the nonlinear component. For further details about this analysis or about the possible errors associated with the analysis, readers are referred to Kalluri and Shera (2001) and Shaffer et al., (2003).
Figure 3.Ā The IFFT and time-windowing analysis were applied to the fine structure data given in Figure 1.Ā After IFFT, two dominant peaks result in the time domain, the nonlinear component (blue) and the reflection component (light purple).Ā For the time domain data, axes are given at the top and to the right.Ā The dominant nonlinear and reflection component peaks were then isolated by time-windowing and converted back into the frequency domain by FFT.Ā The nonlinear component DP-gram is shown in red and the reflection component DP-gram is shown in green.Ā Axes for the frequency domain data appear at the bottom and to the left.Ā Note that while some amplitude variation remains in the component DP-grams, it does not show the periodicity of the original fine structure suggesting that it is not related to two-source interference.Ā Such residual amplitude variation may come from the unmixing of the sources during analysis (Kalluri & Shera, 2001) or may represent natural variation in the components across frequency.
The appeal of a “single-source” orĀ “component” DP-gram is that limiting the DP-gram to a single component removes the fine structure-related amplitude variation that arises from multiple components.Ā Therefore, normative data based on single-source DP-grams may exhibit less amplitude variance.Ā To the extent that fine structure is responsible for the tremendous variability noted in correlations of behavioral threshold to DPOAE level, correlations based on a component DP-gram might improve threshold predictions.Ā Toward this end, we correlated DPOAE level obtained using a suppression paradigm to behavioral thresholds.Ā Results suggest that correlation coefficients while statistically significant at some frequencies, in general, do not improve and are still quite variable when suppression is used to remove the reflection component.Ā A manuscript of these findings and how they can be interpreted in light of generation theory was recently submitted for review. Conclusions
OAE generation theory suggests that DPOAEs arise from two different generation mechanisms and may involve multiple generation sources.Ā The interaction of multiple components leads to amplitude variation in the composite ear canal signal.Ā Clinical interpretation of OAE test results is complicated by the presence of this amplitude variation, which is known as fine structure.Ā Not only do multiple sources challenge the idea that the test frequency is assessing the sensitivity of a single cochlear location, but the amplitude variation resulting from multiple sources yields normative data with a large range of variance causing overlap of response distributions between normal and hearing impaired populations, and limiting the potential of correlational analyses to consistently predict hearing thresholds.Ā Methods that allow the isolation of DPOAE components may have some clinical utility.ĀĀ Studies are needed to determine whether component DP-grams and component DP-I/O functions can be used to better predict behavioral thresholds.
References Avan, P., Bonfils, P., Loth, D., & Wit, H.P. (1993). Temporal patterns of transient-evoked otoacoustic emissions in normal and impaired cochleae.Ā Hearing Research, 70, 109-120.
Boege, P., & Janssen, T. (2002).Ā Pure-tone threshold estimation from extrapolated distortion product emission I/O functions in normal and cochlear hearing loss ears. Journal of the Acoustical Society of America, 111, 1810-1818.
Brown, A.M., Harris, F.P., & Beveridge, H.A. (1996).Ā Two sources of acoustic distortion products from the human cochlea. Journal of the Acoustical Society of America, 100, 3260-3267.
Dhar, S., Talmadge, C.L., Long, G.R., & Tubis, A. (2002).Ā Multiple internal reflections in the cochlea and their effect on DPOAE fine structure.Ā Journal of the Acoustical Society of America, 112, 2883-2897.
Gaskill, S.A., & Brown, A.M. (1996). Suppression of human acoustic distortion product: dual origin of 2f1-f2. Journal of the Acoustical Society of America, 100, 3268-3274.
Gorga, M.P., Neely, S.T., Ohlrich, B., Hoover, B., Redner, J., & Peters, J. (1997). From the laboratory to clinic:Ā A large scale study of distortion product otoacoustic emissions in ears with normal hearing and ears with hearing loss.Ā Ear & Hearing, 18, 440-455.
Gorga, M., Neely, S., Dorn, P., & Hoover, B. (2003).Ā Further efforts to predict pure-tone thresholds from distortion product otoacoustic emission input/ouput functions.Ā Journal of the Acoustical Society of America, 113, 3275-3284.
He, N.H., & Schmiedt, R.A. (1993).Ā Fine structure of the 2f1-f2 acoustic distortion product:Ā Changes with primary level.Ā Journal of the Acoustical Society of America, 94, 2659-2669.
Heitmann, J., Waldmann, B., & Plinkert, P.K. (1996).Ā Limitations in the use of distortion product otoacoustic emissions in objective audiometry as the result of fine structure. European Archives of Otorhinolaryngology, 253, 167-171.
Heitmann, J., Waldmann, B., Schnitzler, H.P., Plinkert, P.K., & Zenner, H.P. (1998). Suppression of distortion product otoacoustic emissions (DPOAE) near 2f1-f2 removes DP-gram fine structure - Evidence for a second generator. Journal of the Acoustical Society of America, 103, 1527-1531.
Kalluri R., & Shera, C.A. (2001). Distortion-product source unmixing:Ā A test of the two-mechanism model for DPOAE generation. Journal of the Acoustical Society of America, 109, 622-637.
Kemp, D.T. (1986). Otoacoustic emissions, traveling waves and cochlear mechanisms. Hearing Research, 22, 95-104.
Kemp, D. T. (2002).Ā Exploring cochlear status with otoacoustic emissions:Ā The potential for new clinical applications, In M.S. Robinette and T.J. Glattke (Eds), Otoacoustic Emissions:Ā Clinical Applications, New York: Thieme.
Kemp, D.T., & Brown, A.M. (1983). An integrated view of the cochlear mechanical nonlinearities observable in the ear canal. In E. de Boer & M.A. ViergeverĀ (Eds) Mechanics of Hearing (pp. 75-82).Ā The Hague, The Netherlands:Ā Martinus Nijhoff.
Kummer, P., Janssen, T., & Arnold, W. (1995). Suppression tuning characteristics of the 2f1-f2 distortion product otoacoustic emission in humans. Journal of the Acoustical Society of America, 98, 197-210. Ā Long, G.R., Talmadge, C.L., & Thorpe, C.A. (2001). Experimental measurement of level dependence of stimulus frequency otoacoustic emissions fine structure.Ā Association for Research in Otolaryngology:Ā Abstracts of the Twenty-fourth Midwinter Meeting, 46, 13.
Shaffer, Withnell, Dhar, Lilly, Harmon, & Goodman (2003). Sources and Mechanisms of DPOAE Generation:Ā Implications for the Prediction of Auditory Sensitivity Ear and Hearing, 24, 367-379.
Shera, C.A., & Guinan, J.J. Jr. (1999). Evoked otoacoustic emissions arise by two fundamentally different mechanisms:Ā A taxonomy for mammalian OAEs. Journal of the Acoustical Society of America, 105, 782-798.
Stover, L.J., Neely, S.T., & Gorga, M.P. (1996). Latency and multiple sources of distortion product emissions. Journal of the Acoustical Society of America, 99, 1016-1024.
Talmadge, C.L., Long, G.R., Tubis, A., & Dhar, S. (1999). Experimental confirmation of the two-source interference model for the fine structure of distortion product otoacoustic emissions. Journal of the Acoustical Society of America, 105, 275-292.
Talmadge, C.L., Tubis, A., Long, G.R., & Piskorski, P. (1998). Modeling otoacoustic and hearing threshold fine structure. Journal of the Acoustical Society of America, 104, 1517-1543.
Talmadge, C.L., Tubis, A., Piskorski, P., & Long, G.R. (1997).Ā Modeling otoacoustic emissions fine structure.Ā In E. Lewis, G. Long, R. Lyon, P. Narins and C. Steele (Eds), Diversity in Auditory Mechanics, Singapore:Ā World Scientific, pp. 462-471.
Talmadge, C.L., Tubis, A., Long, G.R., & Piskorski, P. (1996).Ā Evidence for the spatial origins, of the fine structure of distortion product otoacoustic emissions in humans, and its implications:Ā Experimental and modeling results, Abstracts of the Nineteeth Midwinter Meeting of the Association for Research in Otolaryngology, p. 94.
Waldmann B.,Ā Heitmann, J., & Plinkert, P. (1997).Ā Distorsionsproducte (sgDPOAE):Ā Entwicklung eines neuen prazisionsme systems.Ā Audiologische Akustic, 1, 22-31.
Withnell, R.H., Yates, G.K., & Kirk, D.L. (2000).Ā Changes to low-frequency components of the TEOAE following acoustic trauma to the base of the cochlea.Ā Hearing Research, 139, 1-12.
Yates, G.K., & Withnell, R.H. (1999). The role of intermodulation distortion in transient-evoked otoacoustic emissions, Hearing Research, 136, 49-64.
Zweig, G., &Ā Shera, C. (1995). The origins of periodicity in the spectrum of evoked otoacoustic emissions. Journal of the Acoustical Society of America, 98, 2018-2047.
ĀĀĀĀĀĀĀĀĀĀĀ
1
The publication entitled “Sources
and Mechanisms of DPOAE Generation:Ā Implications for the Prediction
of Auditory Sensitivity” contains an error in publishing.Ā
References to “2f2-f2” are in
error and should read “2f1-f2”. [2] Data used for illustration in this paper were collected
with the approval of the Indiana University Bloomington Campus Committee
|